TradingView pour débutant : premier graphique, alerte et trade fictif
Votre premier exercice, sans argent réel
Oubliez les écrans remplis d'indicateurs. Votre objectif : retrouver un graphique enregistré, créer une alerte de prix et reconnaître un compte de simulation. Prévoyez environ 20 à 30 minutes, à votre rythme. Ce n'est ni une formation pour gagner rapidement ni une invitation à ouvrir un compte de courtage.
Commencez dans un navigateur sur ordinateur. Le guide reste lisible sur téléphone, mais les boutons de TradingView y sont disposés autrement.
Vous n'avez jamais eu de compte TradingView ? Commencer gratuitement avec le parcours Starter. Choisissez premier compte ou compte existant, puis retrouvez sept exercices. La progression est conservée dans ce navigateur.
Lien partenaire divulgué : Strategy Arena peut recevoir une commission sur un futur abonnement web éligible. Aucun achat n'est nécessaire pour commencer. Si vous avez déjà un compte, gardez-le : le parcours propose un lien neutre.
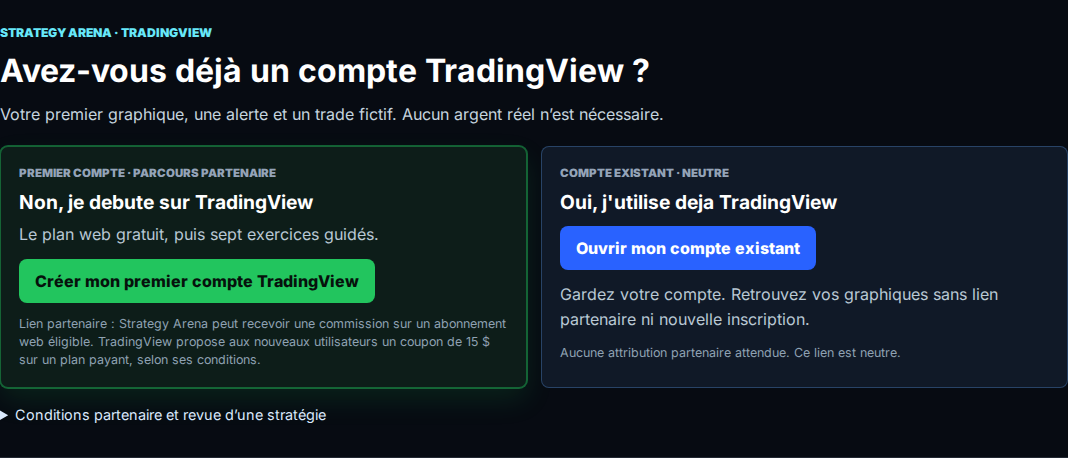
Le choix de compte dans Strategy Arena, avant l'ouverture de TradingView.
1. Reconnaître ce que montre le graphique
Après la connexion, ouvrez Supercharts. Cherchez par exemple BTCUSD pour
l'exercice, sans que cela constitue une recommandation d'investissement.
Regardez aussi le fournisseur ou la place de cotation : deux sources du même
symbole ne donnent pas forcément les mêmes bougies.
Choisissez des chandeliers, puis l'unité de temps 1 jour. Une bougie représente une journée : ouverture, plus haut, plus bas et clôture. L'unité de temps n'est pas la période totale visible à l'écran.
Ajoutez le symbole à votre liste de suivi. Nommez votre disposition Mon premier graphique et enregistrez-la. Changez de symbole, puis retrouvez celui de l'exercice dans la liste.
Vérification : vous savez nommer le symbole, sa source et son unité de temps. Vous retrouvez votre disposition sans refaire les réglages.
2. Ajouter un indicateur et savoir le retirer
Dans Indicateurs, cherchez la moyenne mobile exponentielle intégrée, souvent nommée Moving Average Exponential. Réglez sa longueur sur 20. Elle résume les prix passés en donnant davantage de poids aux plus récents. Un croisement ne promet aucun mouvement futur.
Ajoutez ensuite le RSI intégré si votre quota le permet. Un RSI élevé ne signifie pas qu'une baisse est certaine, ni qu'il faut vendre.
Vérification : masquez puis réaffichez un indicateur. Si un écran payant apparaît, revenez aux outils intégrés. Vous pouvez continuer avec un seul indicateur ; empiler les scripts n'est pas l'objectif.
3. Créer une alerte de prix, pas un ordre
Sur l'échelle des prix ou dans le menu du graphique, choisissez Ajouter une alerte. Sélectionnez une condition simple sur le prix, nommez-la Exercice de prix, puis vérifiez la condition, la durée et le canal de notification avant de valider.
Une alerte vous prévient ; elle n'achète rien. Cet exercice ne demande ni webhook, ni clé API, ni courtier connecté. N'attendez pas que le prix soit atteint pour poursuivre.
Vérification : retrouvez l'alerte dans la liste et repérez sa suppression. Si le quota est atteint, retirez une ancienne alerte de test devenue inutile. Les alertes techniques sur indicateurs ont des conditions d'accès différentes : cet exercice porte uniquement sur le prix.
Voir le guide de la première alerte.
4. Vérifier la simulation avant le premier clic
L'aide officielle web actuelle indique Trade en haut à droite, puis Paper Trading et Connect. Selon la version ou la langue, l'accès peut aussi apparaître dans le panneau de trading.
Avant toute action, vérifiez que le compte porte bien le nom Paper Trading. Si vous voyez un courtier réel, arrêtez l'exercice et revenez au simulateur. Aucun dépôt ni numéro de carte n'est requis pour cet exercice.
Pour apprendre les commandes, pas pour tester votre talent de trader :
- Notez « exercice de prise en main » comme raison de l'opération.
- Ouvrez une petite position fictive, uniquement dans Paper Trading.
- Repérez la position, son prix d'entrée et son résultat courant.
- Repérez la fermeture et fermez cette position fictive pendant la séance.
- Vérifiez dans l'historique qu'elle n'est plus ouverte.
Si l'instrument est indisponible ou le marché fermé, repérez simplement les commandes. Ne connectez pas un courtier pour terminer le cours. Une simulation ne reproduit pas tous les coûts, exécutions et réactions émotionnelles du réel.
La checklist de fin de séance
| Je sais faire | Mon contrôle |
|---|---|
| Identifier le graphique | Symbole, source et unité de temps reconnus |
| Retrouver ma disposition | « Mon premier graphique » enregistré |
| Expliquer un indicateur | Je sais ce qu'il mesure et comment le retirer |
| Gérer une alerte | Je sais la retrouver et la supprimer |
| Distinguer simulation et réel | Le compte indique Paper Trading |
Vous bloquez sur une ligne ? Reprenez seulement cet exercice. Retrouver les sept étapes du Starter.
Faut-il un abonnement payant maintenant ?
Pas pour commencer ce parcours. Restez sur le gratuit tant qu'il répond à vos besoins. Les quotas d'indicateurs, d'alertes et l'accès au replay dépendent du plan : ne transformez pas une limite rencontrée en achat automatique.
Bar Replay est une suite optionnelle. Si la période ou la fonction voulue n'est pas disponible, passez cet exercice. Lorsqu'un besoin précis apparaît, comparez les limites officielles des plans.
Ensuite : comprendre ce qu'un backtest ne dit pas
Une fois les commandes familières, vous pourrez découvrir Pine et le rapport de stratégie. Un résultat historique positif ne suffit pas à valider une idée. Le Quick Check Strategy Arena vérifie la compatibilité d'un script, pas sa rentabilité. Le Lab et les audits formels ont un rôle différent, avec un protocole et des limites explicites.
Aujourd'hui, le succès est de comprendre les commandes, pas de gagner un trade.
Références et mise à jour
Guide révisé le 5 septembre 2026. Interfaces et limites peuvent changer. Ce guide est indépendant, il n'est pas édité par TradingView.
Votre premier graphique. Votre première alerte de prix.
Choisissez un instrument et suivez l'exercice gratuit. Aucun dépôt, compte Strategy Arena ou Lab à installer.
Liens partenaires signalés pour les premiers comptes, liens neutres pour les comptes existants. Strategy Arena peut percevoir une commission sur un abonnement web éligible. Aucun achat nécessaire pour l'exercice.
⚠️ Avertissement — Cet article est publié à titre informatif et éducatif uniquement. Il ne constitue en aucun cas un conseil en investissement ou une recommandation d'achat/vente. Les performances passées ne préjugent pas des performances futures. Strategy Arena est un simulateur éducatif avec capital virtuel. Faites vos propres recherches avant toute décision d'investissement.