Prisme · Bitcoin chart research
Examine what you think you see on a Bitcoin chart.
A level, a zone, a double bottom: instead of eyeballing them, Prisme measures them, dates them and also shows the cases that failed. The same chart and the same measurements serve humans and their AIs, connected over MCP.
Online now, free, no account: 48 h of Bitcoin without date or price, your probability, then the reveal and your Brier score. Interface in French. Exploration, not a verdict.
Affiliate TradingView link: Strategy Arena may receive a commission on an eligible web subscription. A free account is enough.
01
Measured, never a signal
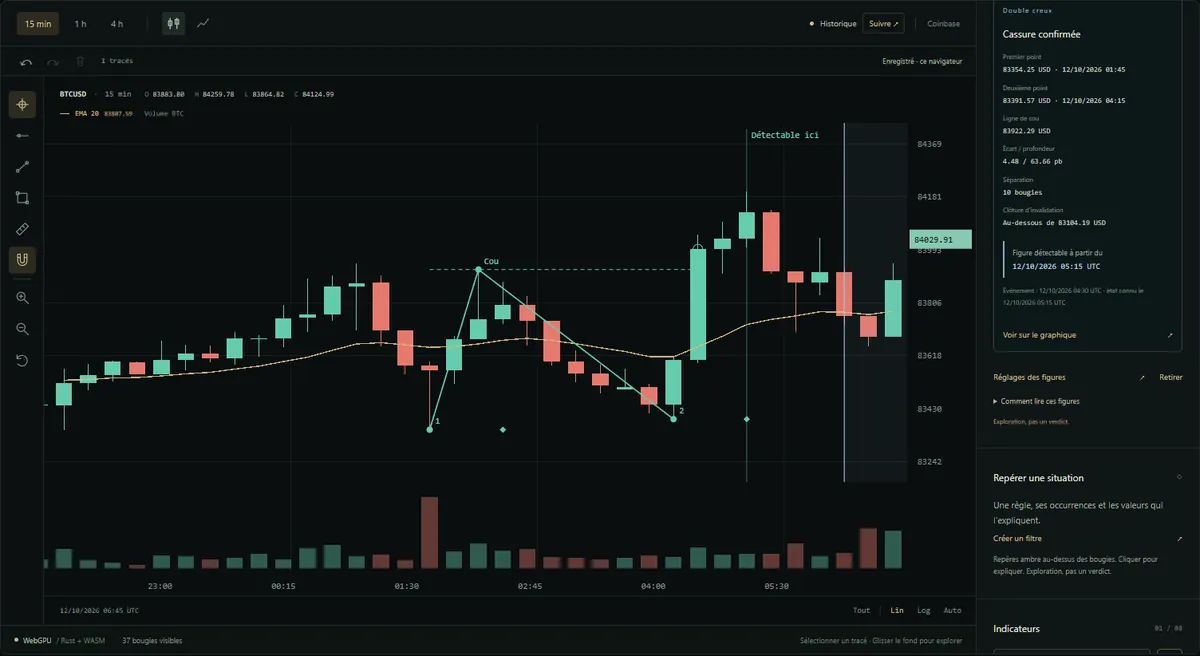
Horizontal levels, price zones, double tops and double bottoms. Prisme counts contacts, confirmed rejections and crossings, keeps incomplete cases apart, and dates the moment a pattern becomes detectable.
Invalidated and expired patterns stay visible. These are descriptive measurements, never a buy or sell signal.
02
A replay that never sees what comes next
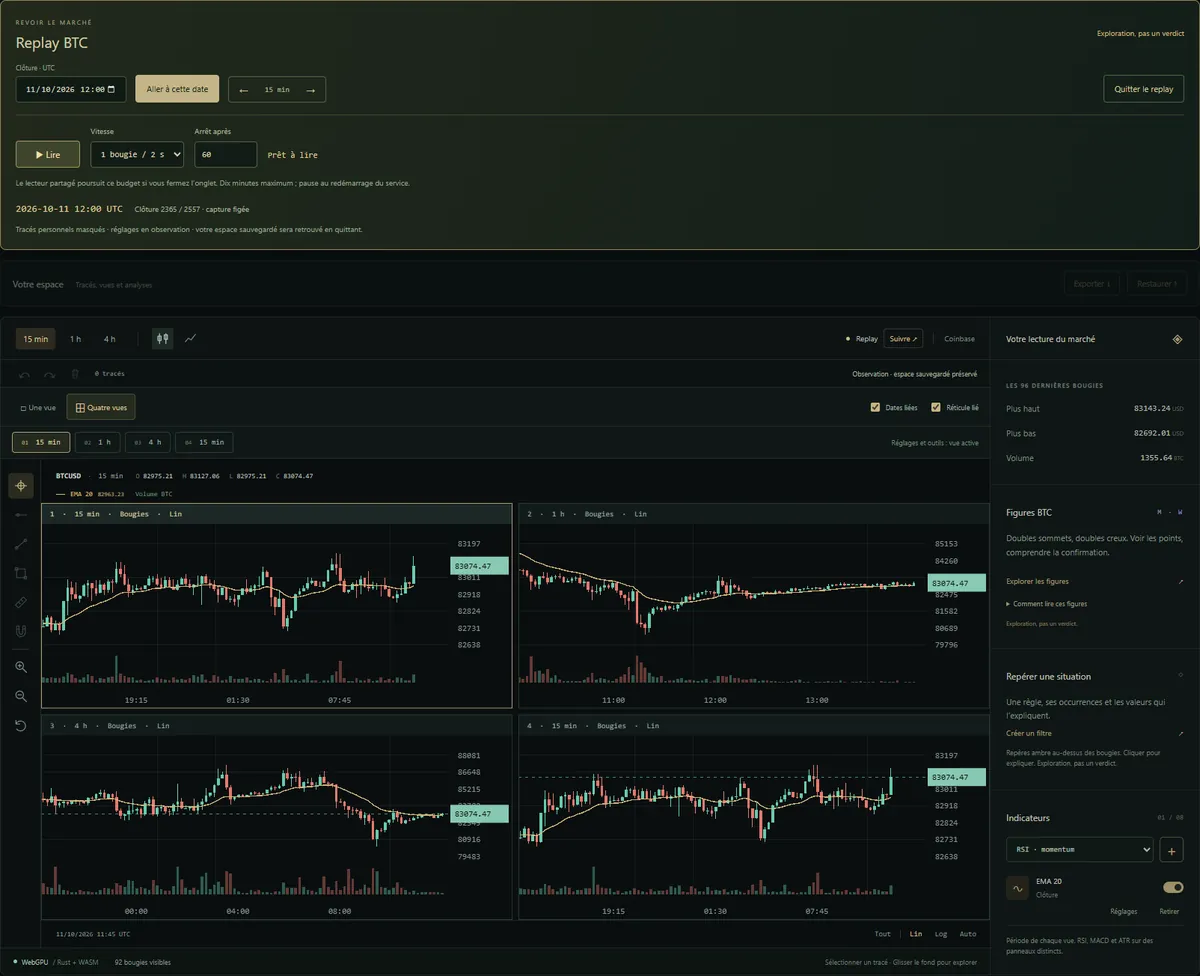
Pick a past date: Prisme cuts the history before computing anything. Candles, indicators and patterns are recomputed as if the future did not exist, across four linked views.
Step by step or automatic playback. Your AI reads the same cut, through the same Rust engine.
03
The blind Arena
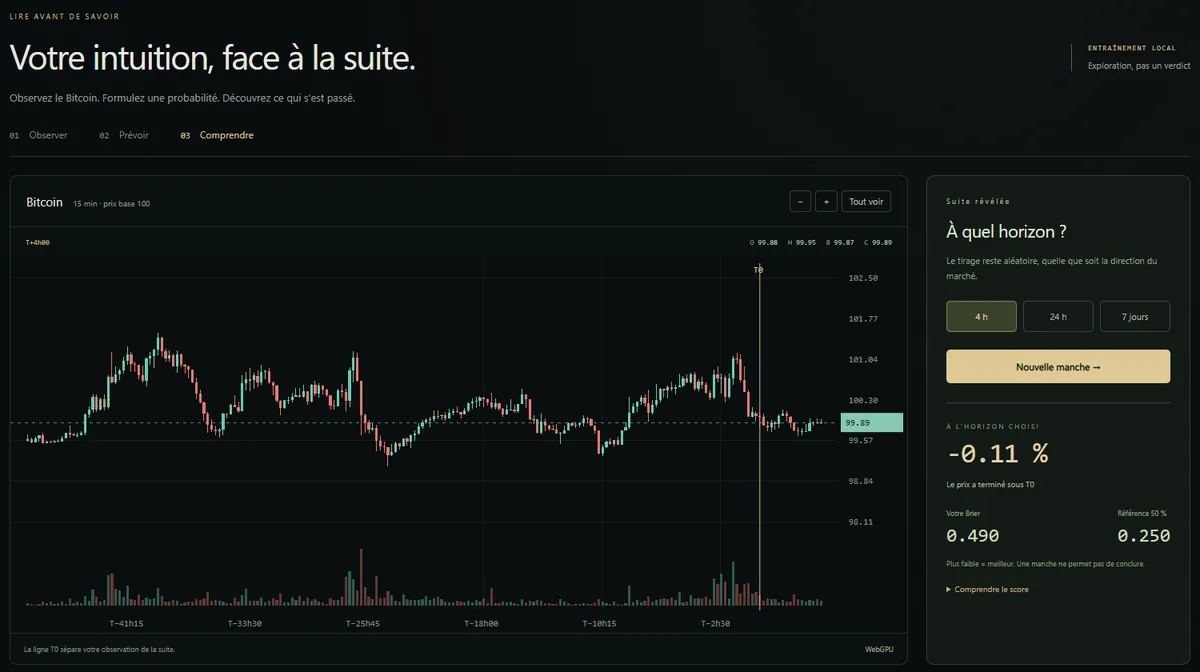
A randomly drawn BTC window, price rebased to 100 and relative dates, so the period is harder to recognise. You call rise or no rise with a confidence level.
The forecast is sealed before the reveal, then scored with the Brier score against the 50% reference. Every round stays in the log, abandoned ones included. Humans and AIs play the same round.
04
The bridge to the Lab
A saved observation (level, zone, filter, double top or bottom) becomes a hypothesis sheet: exact market, declared period already seen, candle fingerprints. The Strategy Arena Lab is the one that judges it.
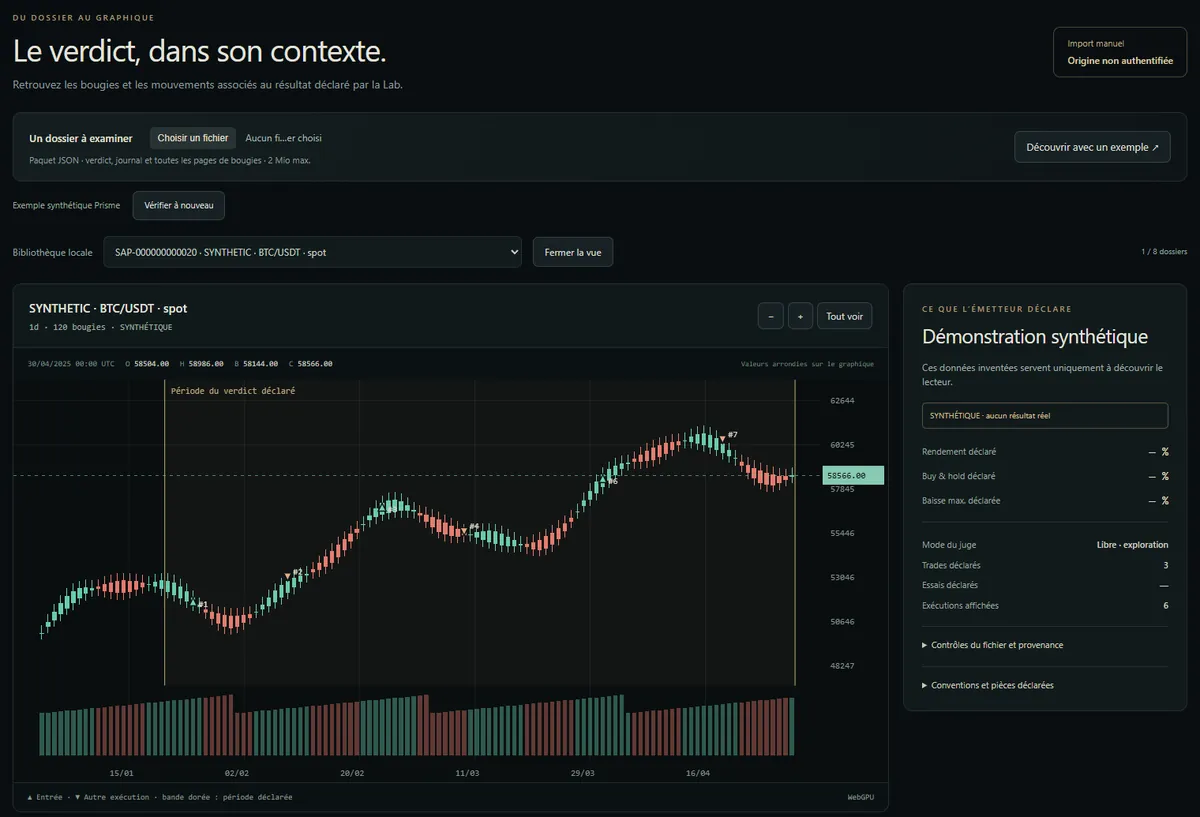
Prisme also reads a Lab result back on its BTC history: declared verdict, log of moves, checked candles. Today the exchange goes through a file, by hand.
Your AI reads the same chart
Prisme exposes its workshop to AI clients over MCP: 38 workshop tools and 7 separate Arena tools in edition 20. An AI can propose a level or an annotation; you keep or remove it. No AI model is embedded and no tool places an order.
Prisme does not replace TradingView, it complements it. You keep your usual chart; Prisme is for checking an idea before believing it, and the Lab gives the verdict.
- Prisme explores. The Lab designs and judges. You decide.
- Built in Rust: the browser (WebAssembly, WebGPU) and the MCP server share the same calculations. 158 Rust tests at edition 20.
- Data: Coinbase BTC/USD spot, public feed.
BTC only. Exploration, not a verdict: only the Strategy Arena Lab judge gives a verdict.
Research on past data, not investment advice. No measurement on this page is a promise of return.